
InfluxDB/Grafana Tutorial
One of the data storage strategies supported by SiteWhere is a hybrid arrangement where device management data is stored in MongoDB while device event data is stored in InfluxDB. This division of labor allows each storage technology to focus on its strengths, with MongoDB being well-suited for the document-oriented nature of the device data and InfluxDB being well-suited for the time-series nature of the event data. Since InfluxDB takes care of common data-tier concerns such as clustering and retention policies, this arrangement is very scalable.
Install SiteWhere
Install a SiteWhere instance with the default settings. By default, the system will be configured to store both device management and event data in MongoDB. Boot the system and verify that you can access the administrative application and see the sample data.
Install InfluxDB
Follow the InfluxDB installation document to create a local InfluxDB instance. Assuming the installation was successful, the InfluxDB admin interface will be available on port 8083. Open a browser and query for a list of databases as shown below:
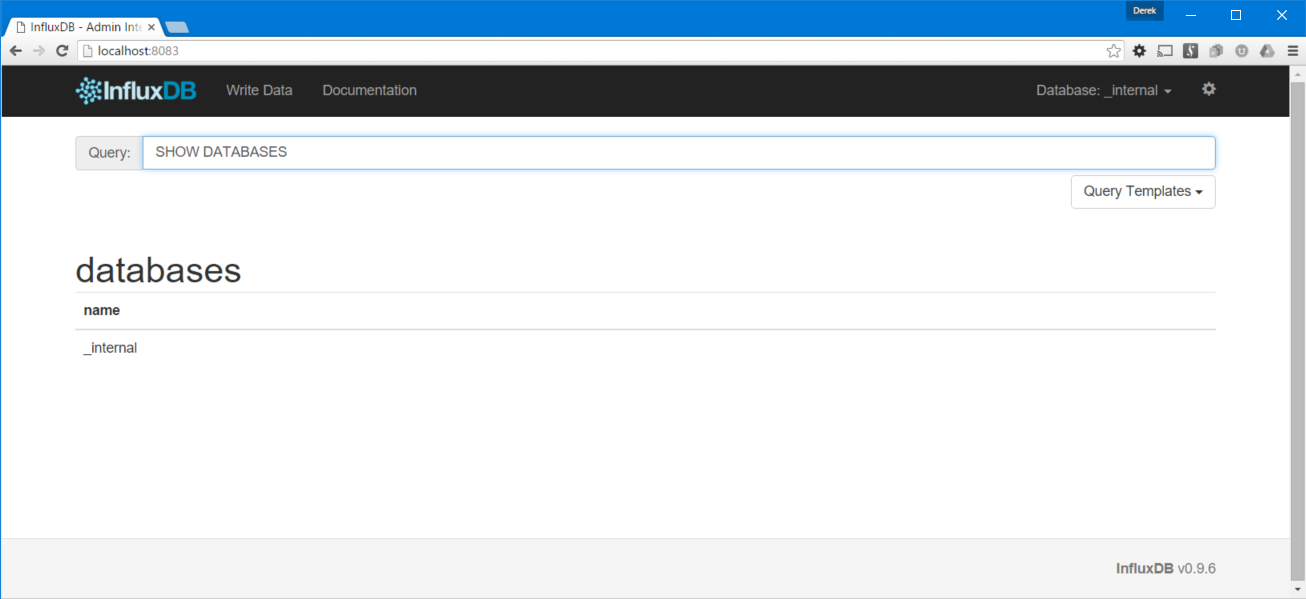
When SiteWhere has been configured to use InfluxDB, a new database will be added automatically to store device event data.
Configure SiteWhere to Use InfluxDB
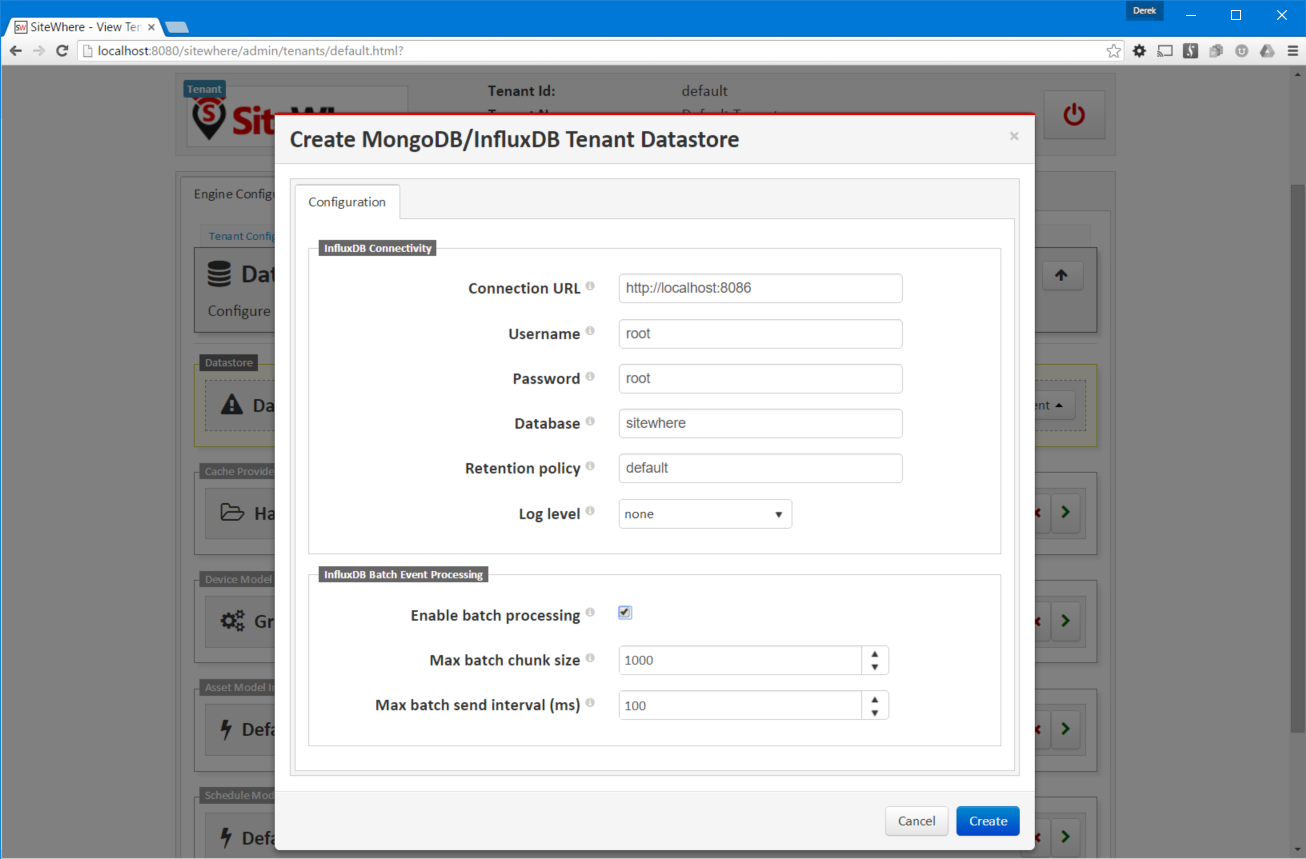
In the SiteWhere administrative interface, click Manage Tenants in the user dropdown at the top-right and open the tenant that will be using InfluxDB for event data. In the tenant configuration editor, choose the Data Management section and find the MongoDB Tenant Datastore entry. Delete the entry by clicking the icon. Now click the Add Component dropdown in the same section and choose MongoDB/InfluxDB Tenant Datastore. Use the default values provided to configure the connection from SiteWhere to InfluxDB as shown below:
Save the changes, then click Stage Updates at the bottom of the editor to stage the configuration changes. Click the icon to stop the tenant. After it stops, click the icon to start it with the updated configuration.
Generate Sample Data into InfluxDB
When SiteWhere first started, it generated event data into MongoDB. In order to trigger the logic that generates sample data, remove the existing tenant database so that SiteWhere will generate new data. Shut down SiteWhere and open a MongoDB prompt. Delete the tenant database by entering:
use tenant-default
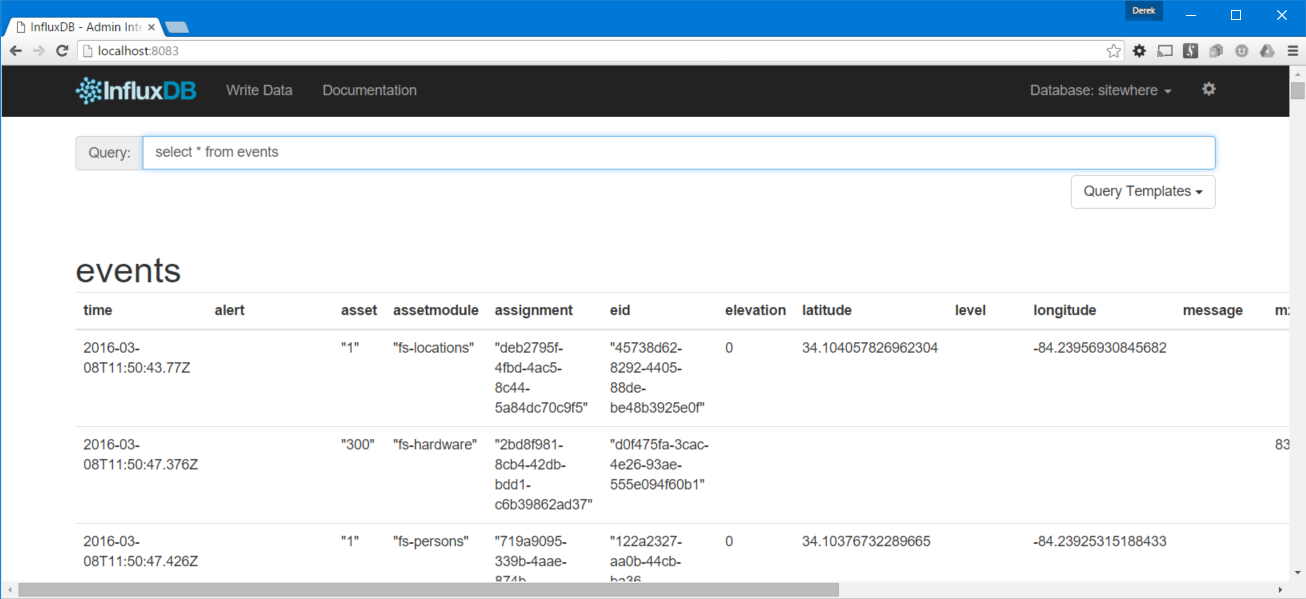
db.dropDatabase()Now restart SiteWhere, which will re-create the device management data and generate event data into the InfluxDB database. Reload the InfluxDB admin interface. A new database sitewhere will appear in the dropdown at the top-right. Choose the SiteWhere database and execute the query select * from events. After a few seconds, the list of SiteWhere events is shown in the browser in tabular format.
Install Grafana
Grafana is a data visualization tool that has built-in connectivity to InfluxDB. Follow the installation documentation to install a local Grafana instance, then open the administrative interface (which defaults to port 8100) as shown below:
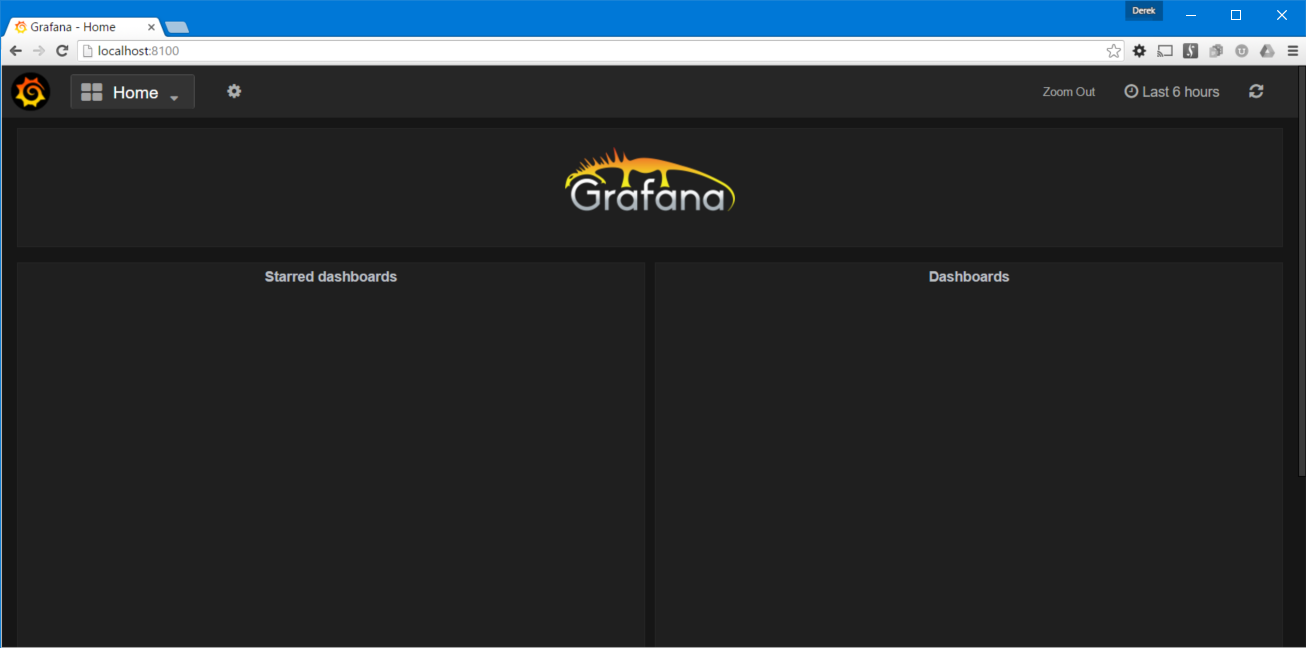
Follow the Grafana instructions to create an organization and a user so that you can manage data sources and dashboards.
Click the toolbar icon in the top-left corner and choose Data Sources, then click Add new to create a new data source for InfluxDB. Enter the data as shown below:
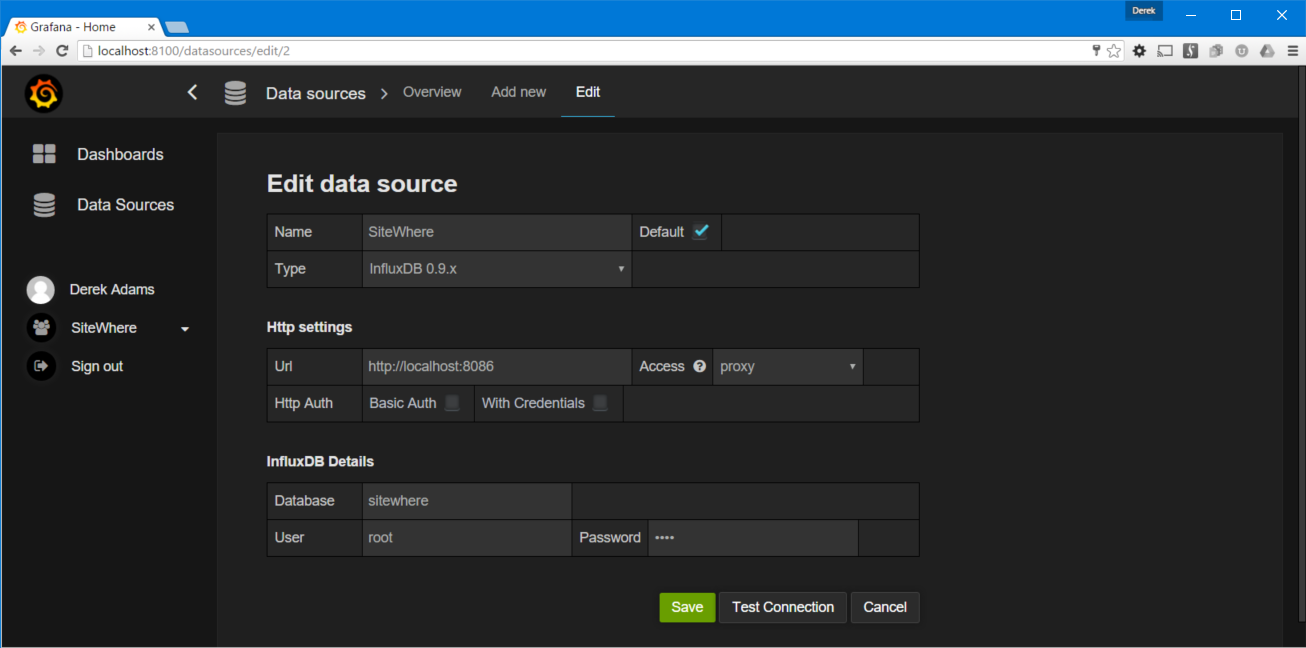
Click Test Connection to verify that Grafana can connect to your InfluxDB instance.
Visualize SiteWhere Data
With InfluxDB and Grafana configured to communicate with each other, the next step is to create a custom dashboard to view SiteWhere data in a graphical format. From the dashboard dropdown at the top of the application click the Add button at the bottom of the panel. Enter SiteWhere as the dashboard name. A new dashboard with a single row will be created. Mouse over the green box at the left of the row to get a toolbar as shown below:
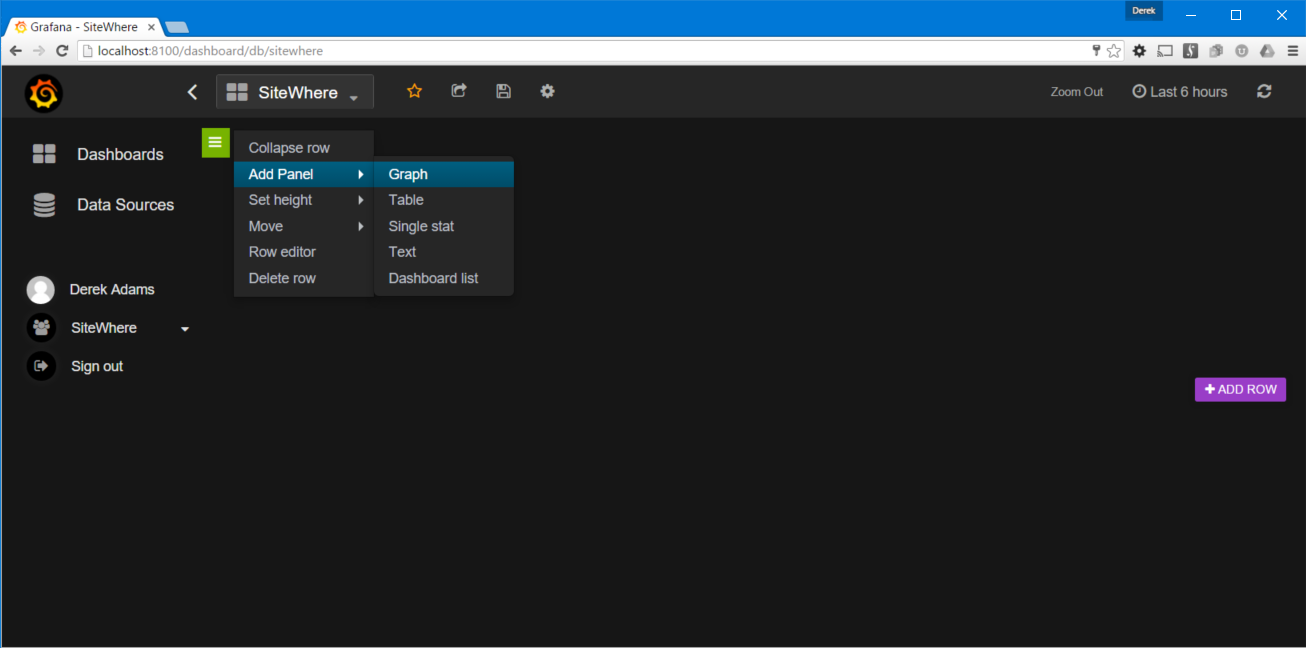
Click Add Panel > Graph to add a graph to the panel. This opens the interactive query editor which will allow the graph query and visuals to be specified. Grafana supplies values from InfluxDB to make building the query easier.
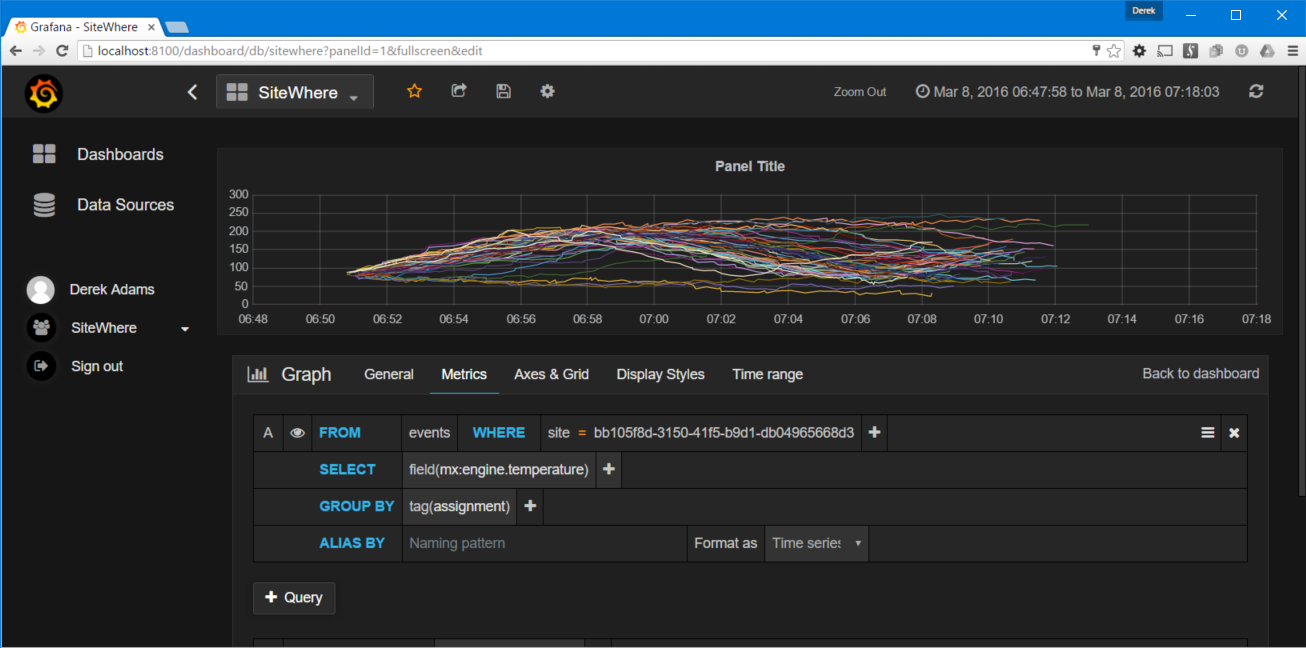
Choose events as the value for from, then choose site and the default site id for the where clause. To visualize the engine temperature measurements in the sample data, choose field(mx:engine.temperature) from the choices provided. The temperatures should be grouped by device assignment, so delete the existing grouping criteria and choose tag(assignment) in the group by dropdown.
Since the sample data that SiteWhere generates is for a short period of time, the timeline will need to be zoomed to see more detail in the data. Drag from left to right in the graph area to zoom in where you see data.
In the Axes & Grid tab, turn off the legend, since it takes up a lot of space to shown the list of all device assignments.
In the Display Styles tab, update Line Fill to 0 and Line Width to 1. The graph should look similar to the one below:
When done customizing the graph, click Back to Dashboard to close the editor. More graphs and other visualizations can be added in a similar fashion to show other data from SiteWhere.
Next Steps
Add custom data from your own devices into SiteWhere and use Grafana to visualize it in interesting ways. The visual query editor allows queries to be created and visualized without the complexity of manual database interactions.